


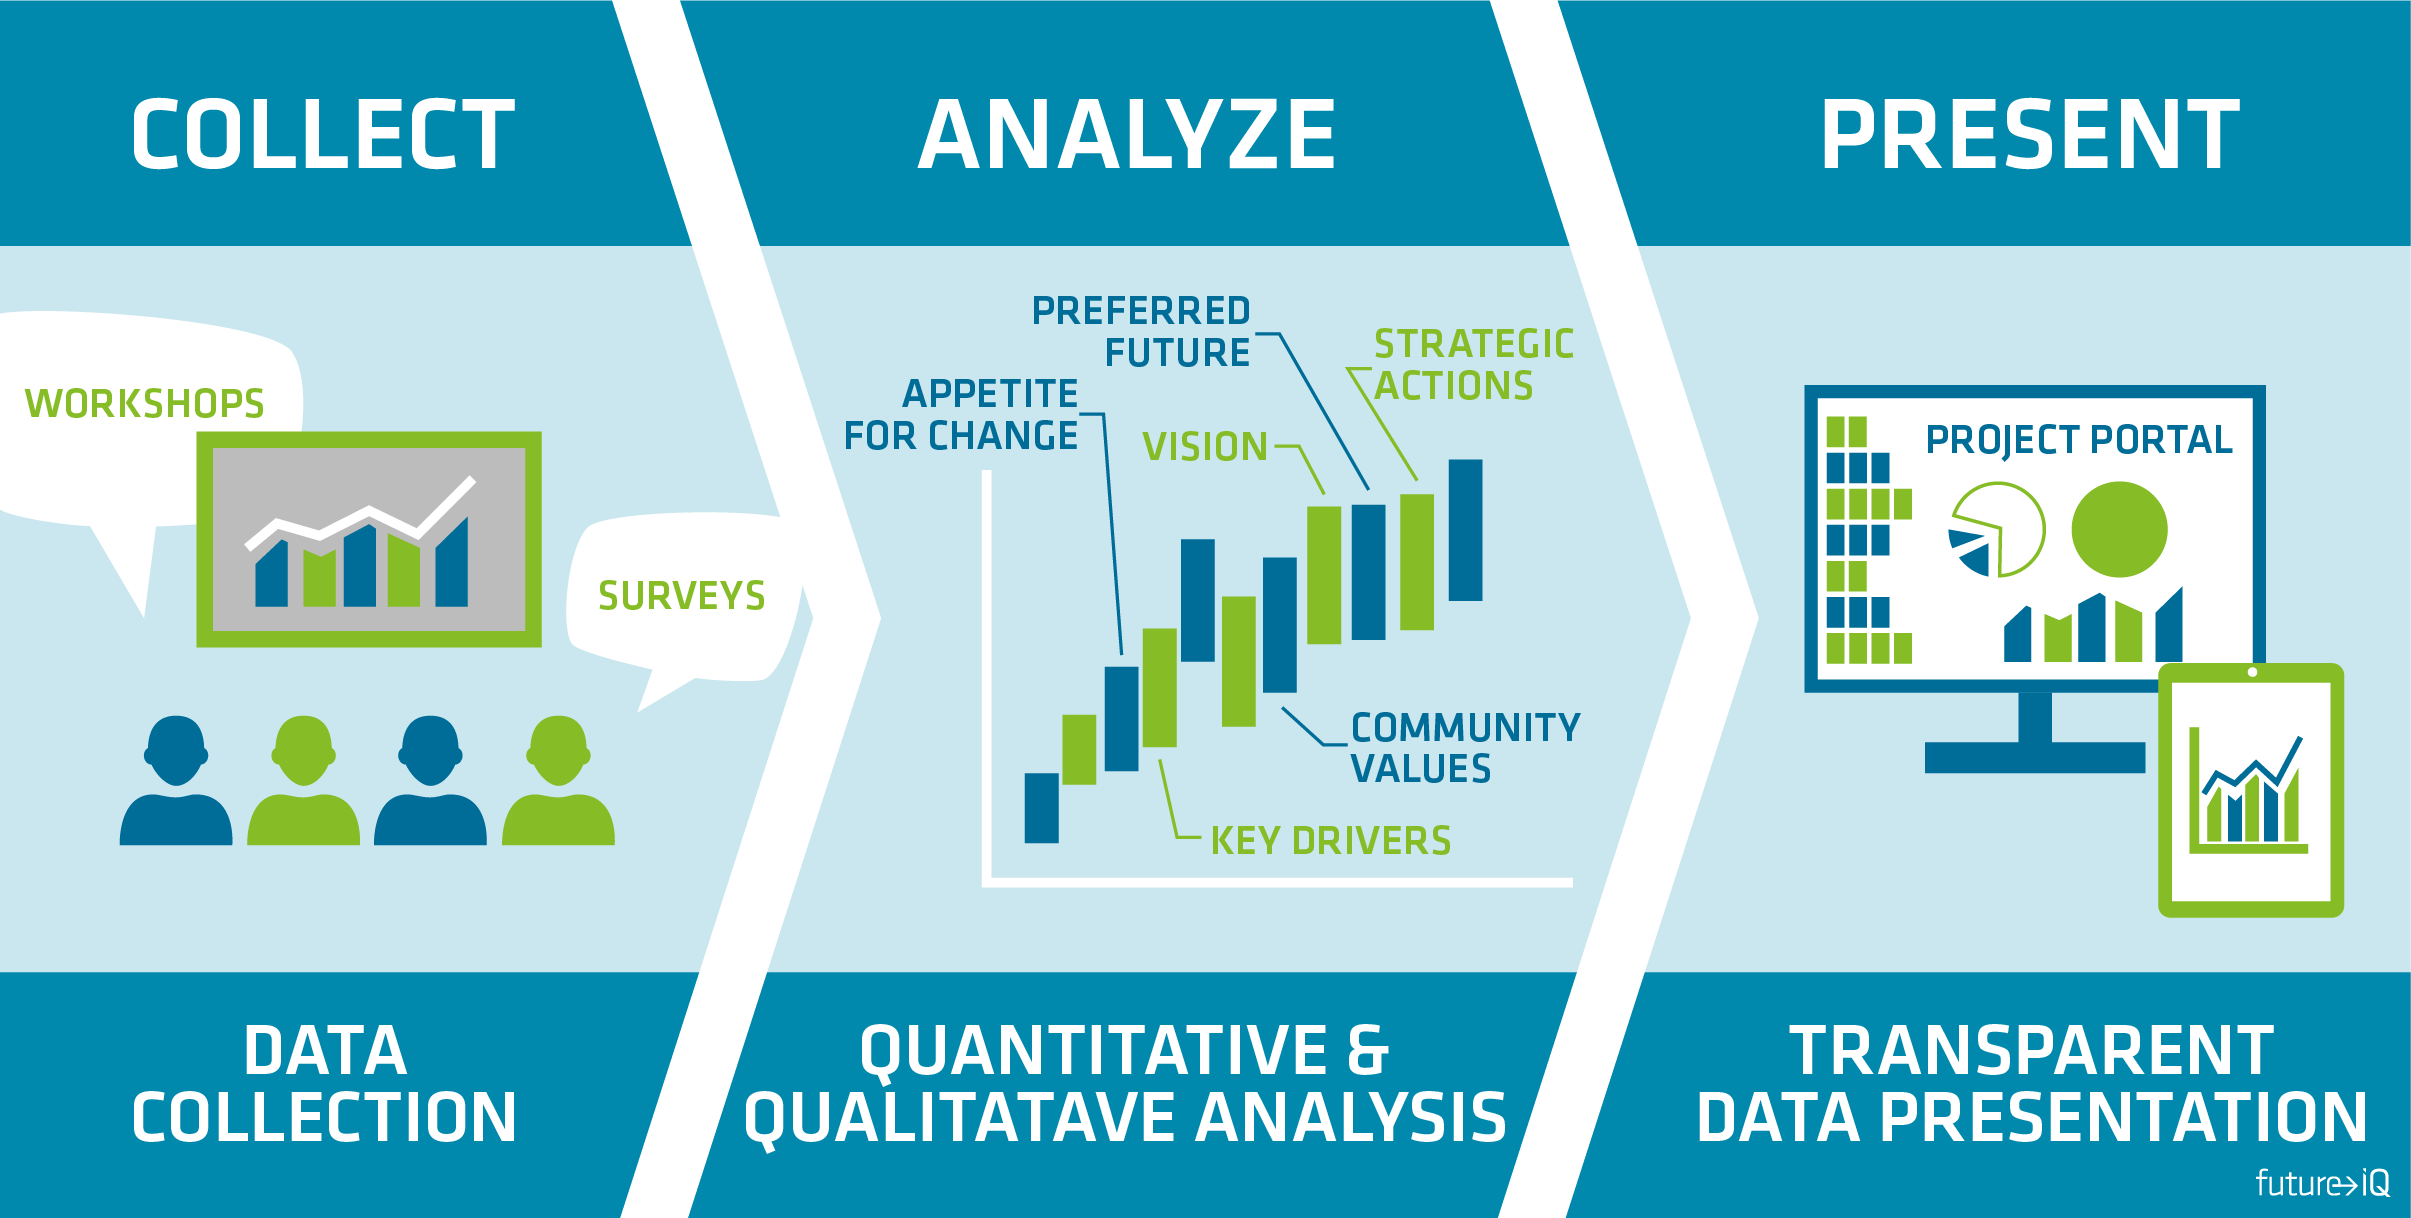
FUTURE IQ®’S DATA VISUALISATION METHODOLOGY PROVIDES YOU WITH A WIDE RANGE OF SIMPLE AND VISUALLY STIMULATING WAYS TO VIEW AND ANALYSE DATA
Future iQ’s Data Visualisation uses a methodology consisting of a range of different ways to analyse multi-faceted data, finding the important trends and patterns which can often be overlooked. Through the use of methods such as info graphics, surveys, trend analysis, benchmarking studies, cluster diagrams and network maps, the stakeholder can drill down into the quantitative and qualitative results. This allows you to achieve a complete appreciation, confidence and understanding of the insights you derive from a data driven approach.
Scope of Techniques
Future iQ’s Data Visualisation methodology displays trends, quantitative and qualitative data, networks and scenarios in a range of easy to use formats in order to obtain the real information. This can be obtained through methods such as surveys, info graphics, online platforms, reports, cluster diagrams and network maps.
Interactive and Innovative
Our data visualisation uses processes that enable individuals and organisations to interrogate and understand the data in a new and transparent way, which builds the internal capacity for innovative and targeted responses.
Clarity and Understanding
Future iQ’s Data Visualisation methodology produces a range of visually stimulating ways to understand complex data so that the stakeholder gains clarity, confidence and understanding, leading to enhanced strategic planning.
Progressive and Unique
This methodology addresses data in a progressive, multi-faceted and unique manner, as Future iQ combines the different processes of visual analysis so stakeholders can obtain the most out of the data.
A DIVERSE PORTFOLIO OF DATA VISUALISATION TECHNIQUES
Future iQ is a pioneer in combining data visualisation methods in order to produce clarity for stakeholders. Future iQ’s combination of a wide range of innovative techniques enable the stakeholder’s clear understanding of the results. This has resulted in global success in presenting data within strategic planning projects.
600000
unique data points67
major projects using data visualisation7
Countries - across 3 Continents – have used our Data Visualisation TechniquesHover over the map to view our portfolio of Data Visualisation projects
DATA VISUALISATION METHODS THAT ENABLE YOU TO QUANTIFY, AND THEN TACKLE COMPLEX ISSUES.
Future iQ’s Data Visualisation uses a methodology consisting of a range of different ways to analyse multi-faceted data, finding the important trends and patterns which can often be overlooked. Our data visualisation use processes that enable individuals and organisations to interrogate and understand the data in a new and transparent way, which builds the internal capacity for innovative and targeted responses. Through the use of methods such as info graphics, surveys, trend analysis, benchmarking studies, cluster diagrams and network maps, the stakeholder can drill down into the quantitative and qualitative results. This allows the stakeholder to achieve a complete appreciation, confidence and understanding of the insights derived from a data driven approach.